

Overview
Analytics aggregates the activity of your AI agent across conversations. It has four pages: Chats, Topics, Sentiment, and Helpdesk. By default it shows the activity for all AI agents in your workspace for the last week.What you can do:
See volume, subject matter, and mood at a glance, and tell whether the changes you made last week actually moved anything.
Analytics aggregates the information, including topics, sentiment, and thumbs down. Activity shows the data per conversation instead.
Chats

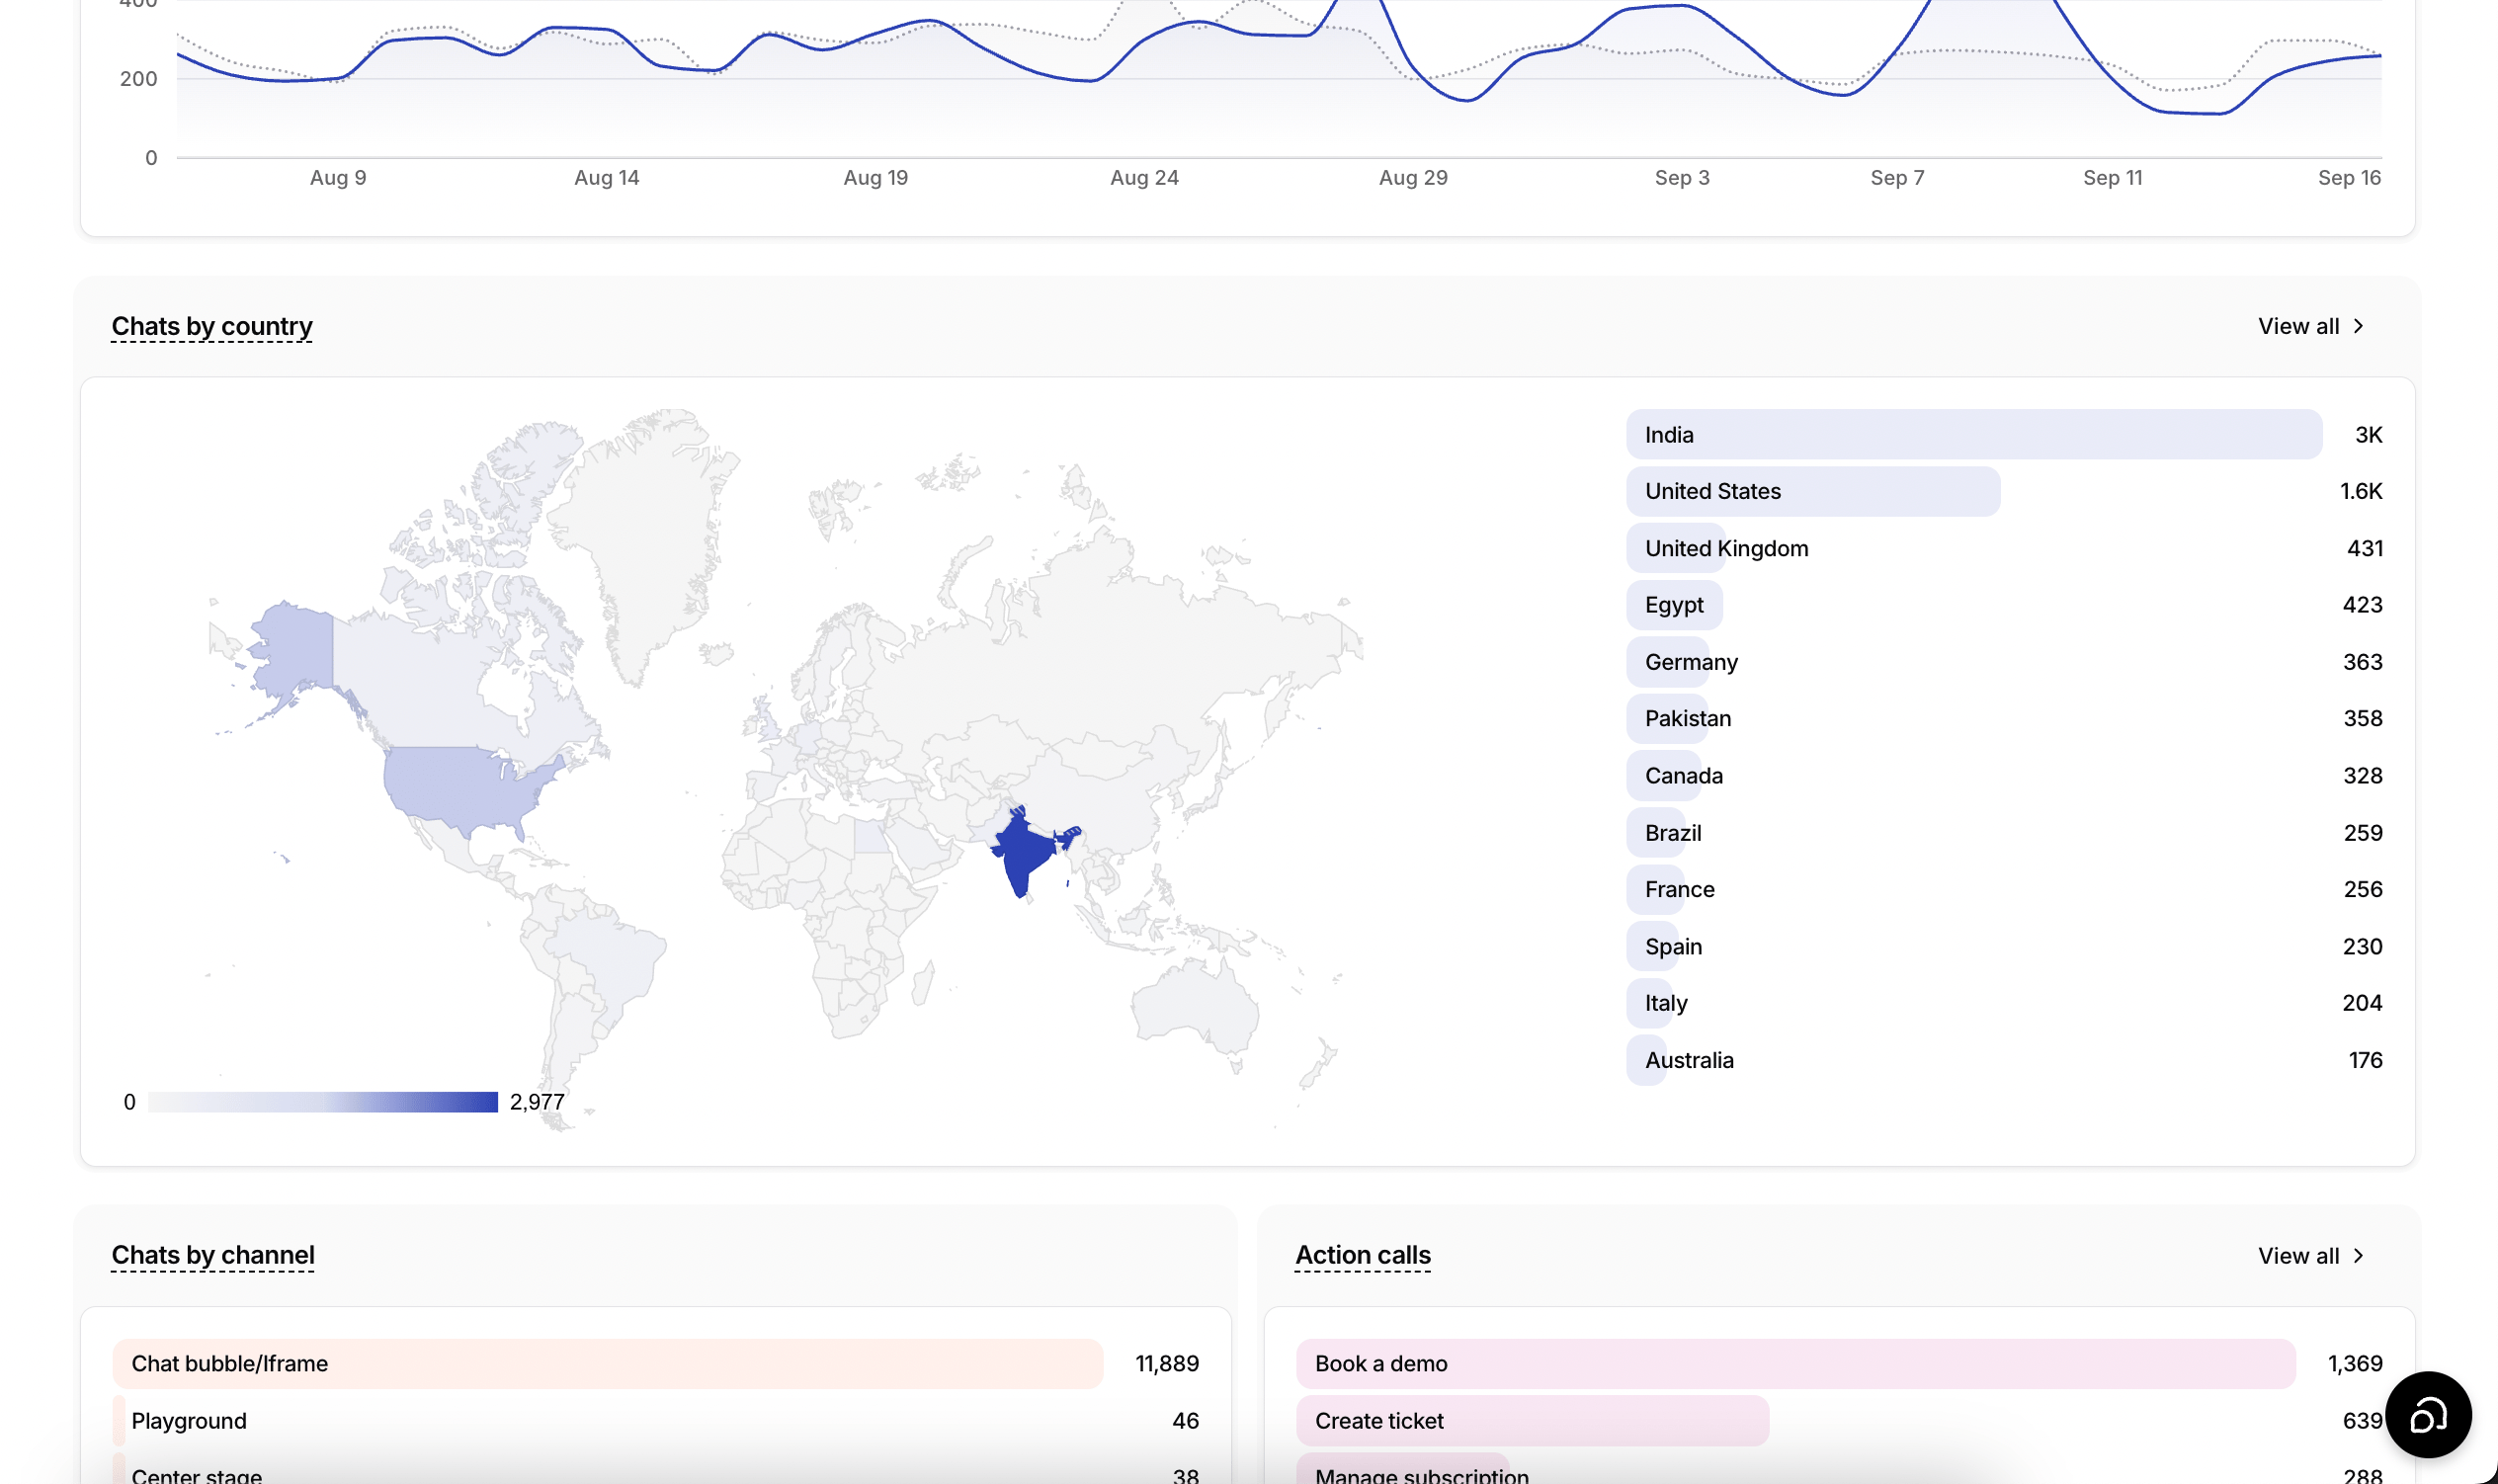
Filtering
You can filter the data by date, using pre-defined ranges such as last 7 days, last 30 days, last 3 months, and last year.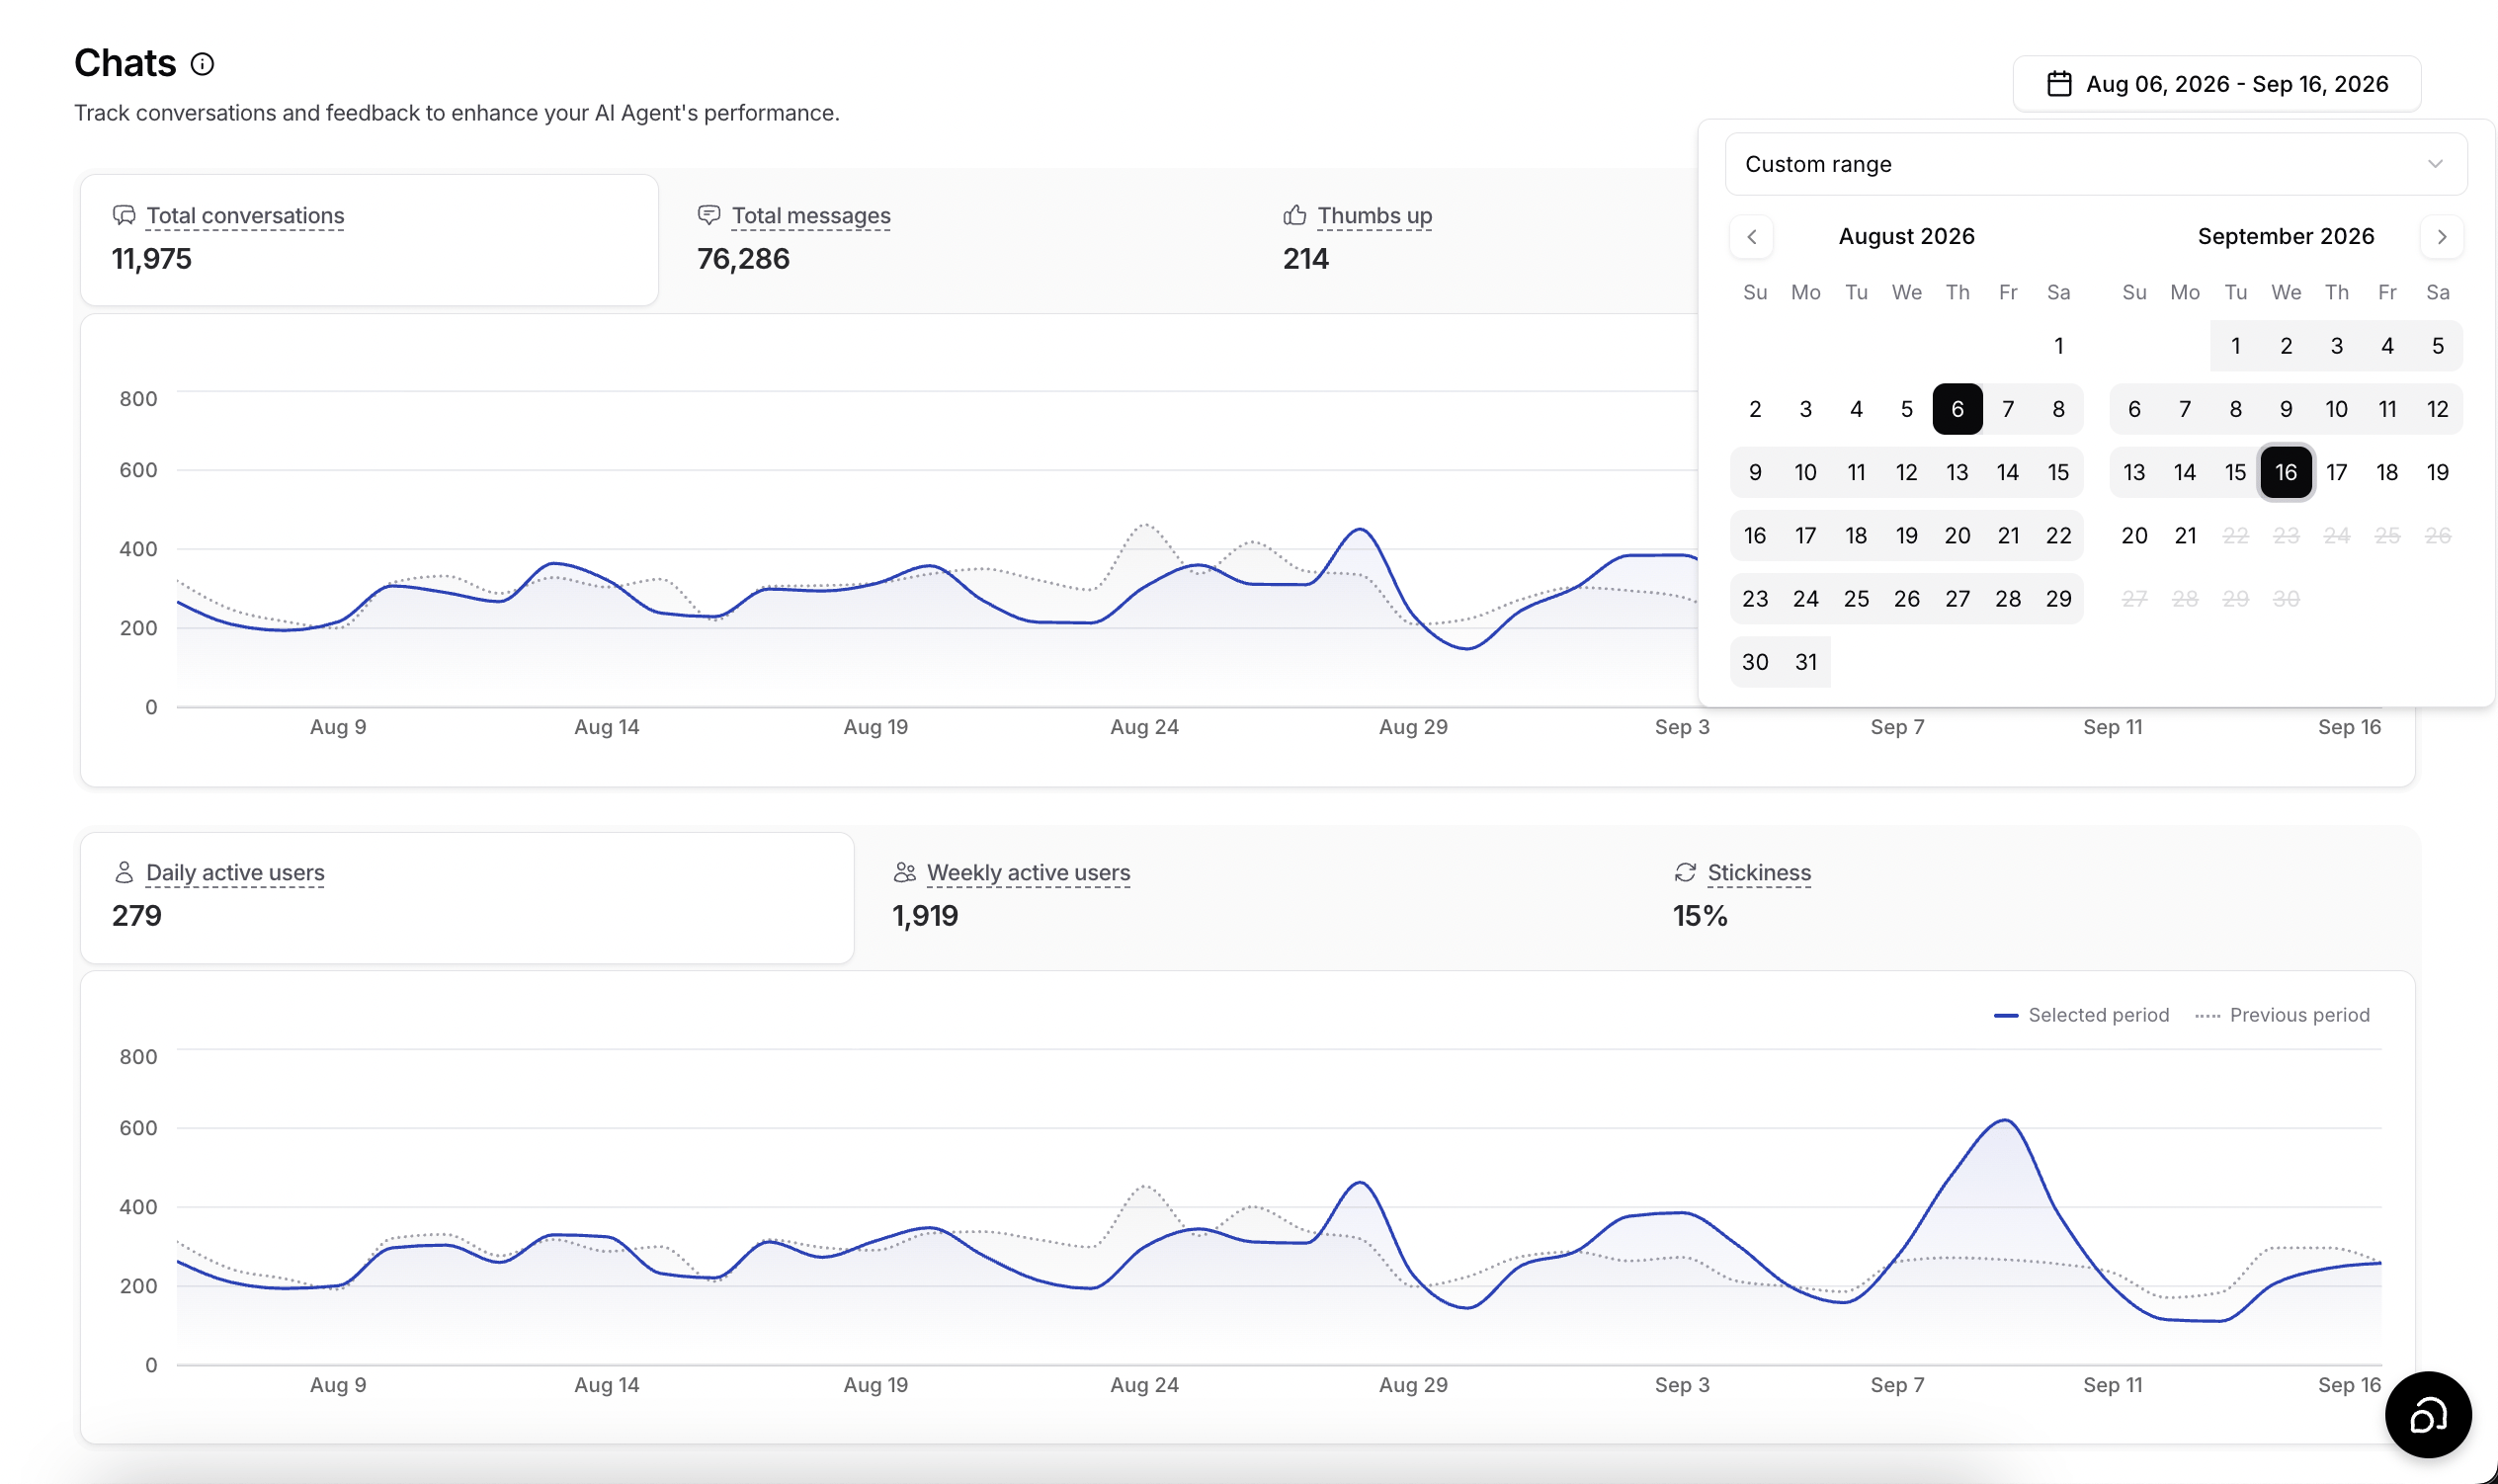
Topics
This page shows what users ask your AI agent about. Topics have two levels: broad topics, each with more specific subtopics, such as a Billing topic with Refunds and Invoices subtopics.Topics are found once a day, for the previous day’s conversations. The first topics appear after a day with at least 30 conversations. Until then the page shows Not enough conversations yet.
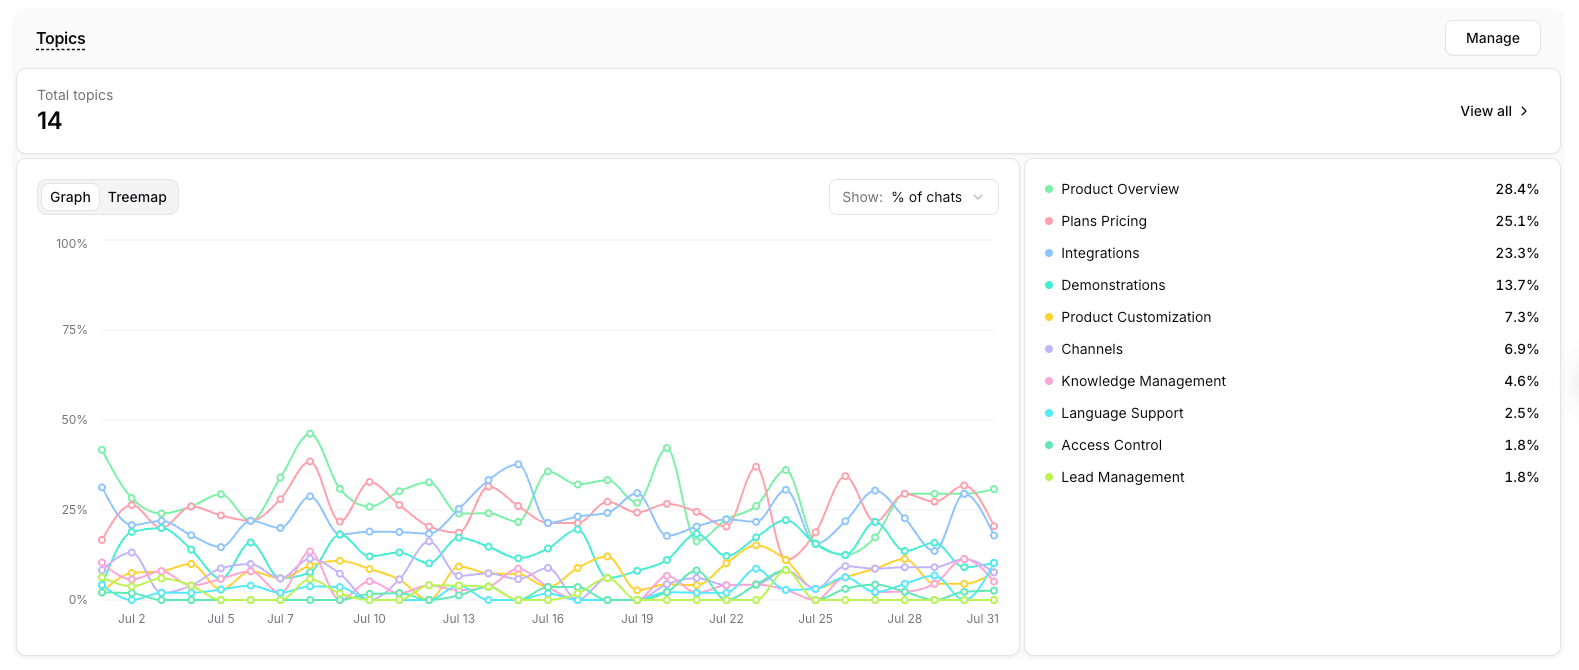
- Graph: each day’s conversations about each of the top 10 topics. Use Show to switch between % of chats (the share of that day’s conversations) and Number of chats.
- Treemap: the top 10 topics as tiles sized by their number of conversations. Each tile is split into its 3 biggest subtopics and one Other tile for the rest. Topics past the top 10 share one grey tile.
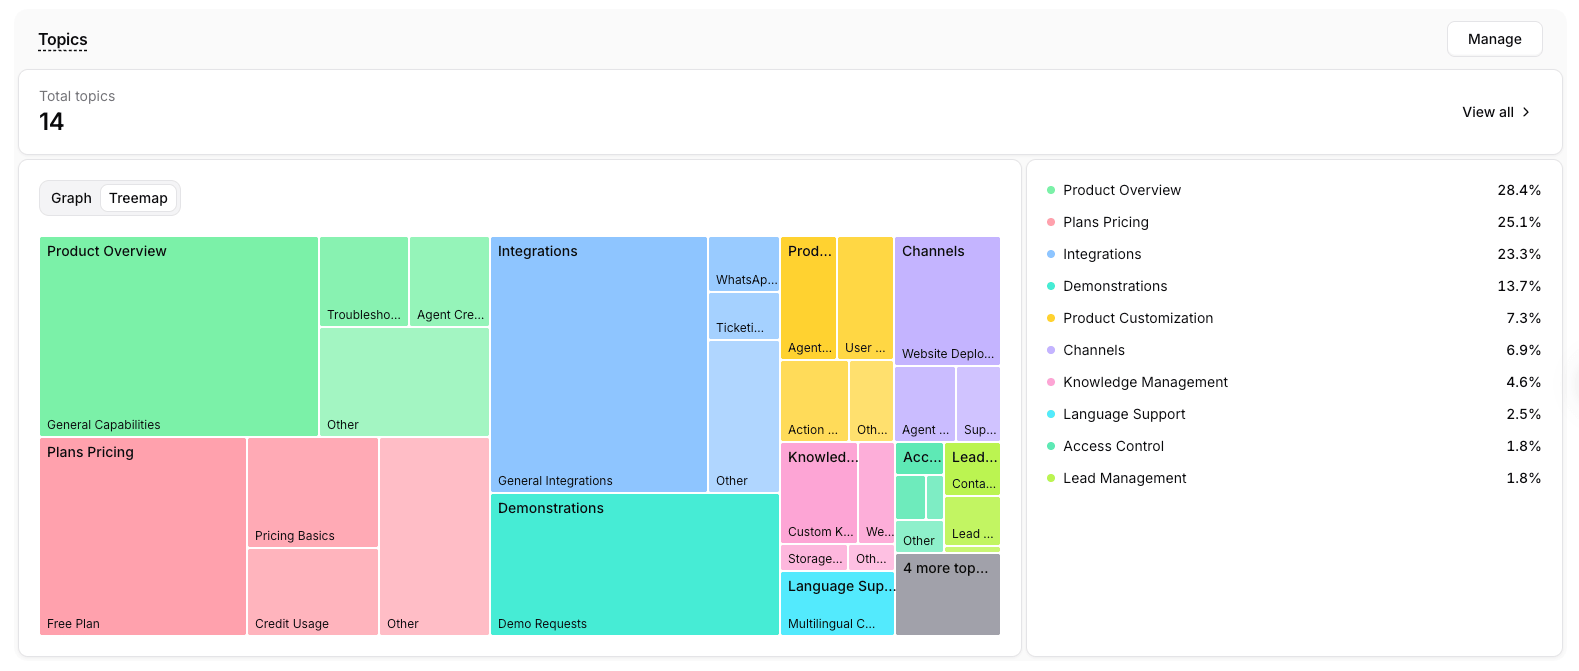
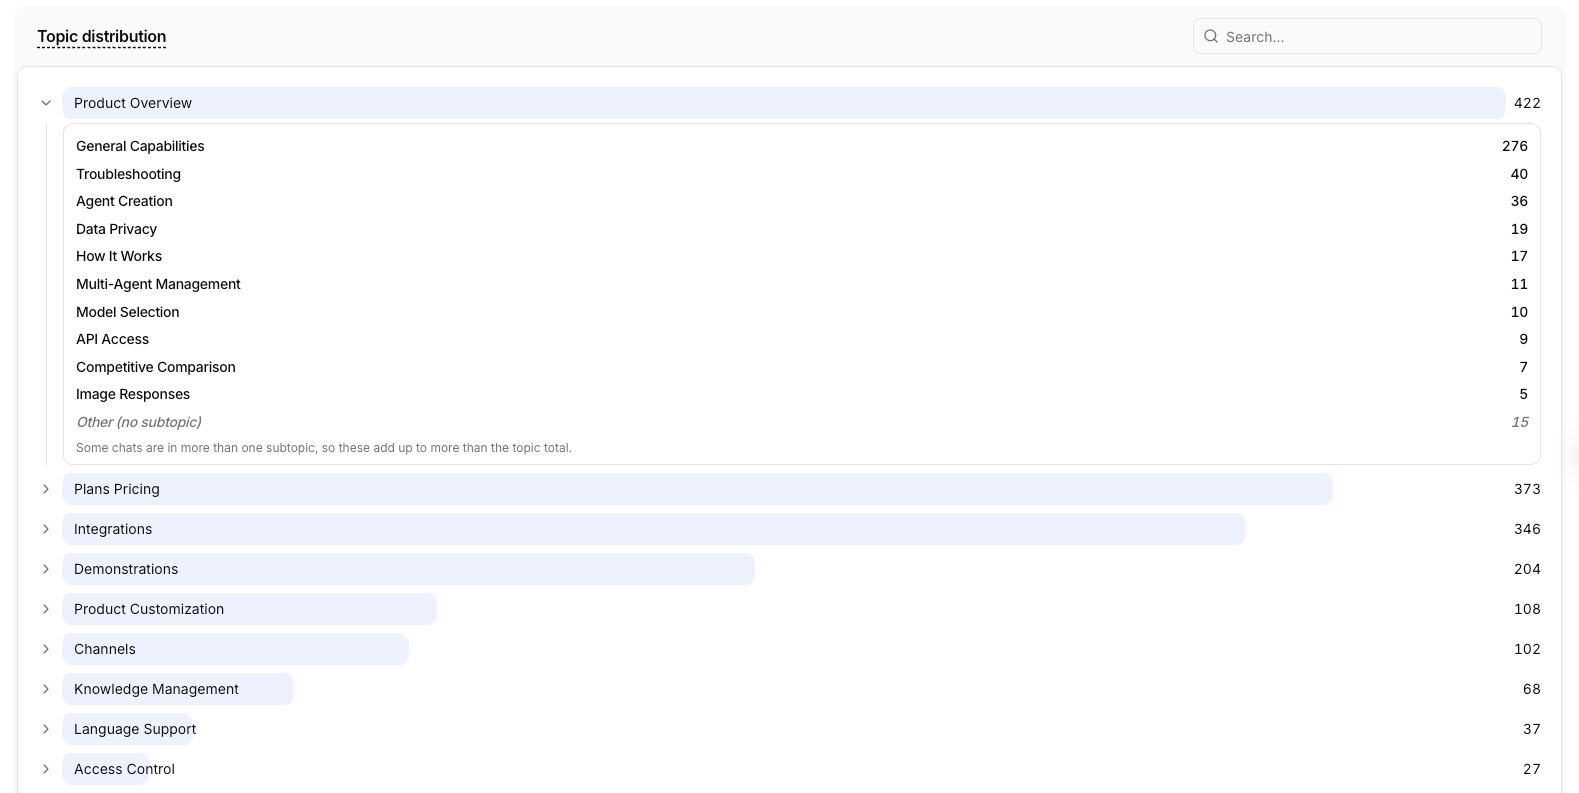
Topic, Subtopic, and Conversations. The (all) row holds each topic’s total.
How topics are found
Each conversation gets up to five topics or subtopics, one for each separate need the user raised. Greetings, thanks, tests, and requests outside your AI agent’s purpose get none. When conversations keep asking about something the current topics don’t cover, the AI agent suggests a new subtopic. It appears on this page once 3 conversations are about it. A suggestion that no new conversation backs for 30 days is dropped. The AI agent keeps its topics to at most 20 topics with up to 10 subtopics each.Manage topics
Click Manage or View all to open Manage topics. Topics with subtopics start collapsed; click the arrow to show them.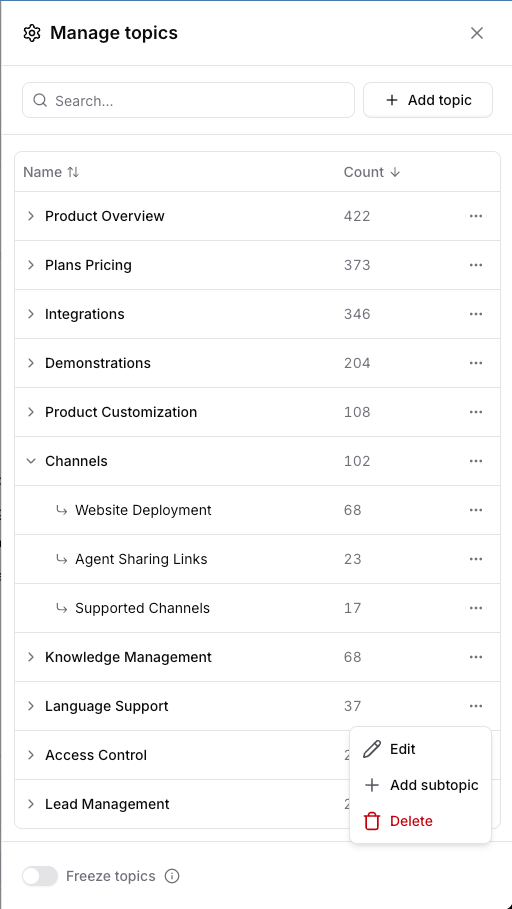
- Add topic: adds a topic. Type its name and press Enter.
- Add subtopic: adds a subtopic under a topic, from the topic’s menu. A topic can have up to 10 subtopics.
- Edit: renames a topic or subtopic.
- Delete: removes a topic or subtopic.
- Freeze topics: pauses automatic topic discovery. Conversations are still tagged with existing topics.
- A topic: it is hidden with its subtopics, and the AI agent does not create a topic with that name again.
- A subtopic: its conversations move to its topic, where they count under Other (no subtopic), unless they are also in another of its subtopics.
- Adding a deleted name again: brings it back with its past conversations, under the topic you add it to. A deleted topic comes back with the subtopics that were deleted with it.
- Adding a name the AI agent suggested: the suggestion becomes a live subtopic and keeps the conversations behind it.
Sentiment
This page shows how the AI agent detects the sentiment and emotion of users during conversations. Sentiment analysis is detected automatically by the AI agent.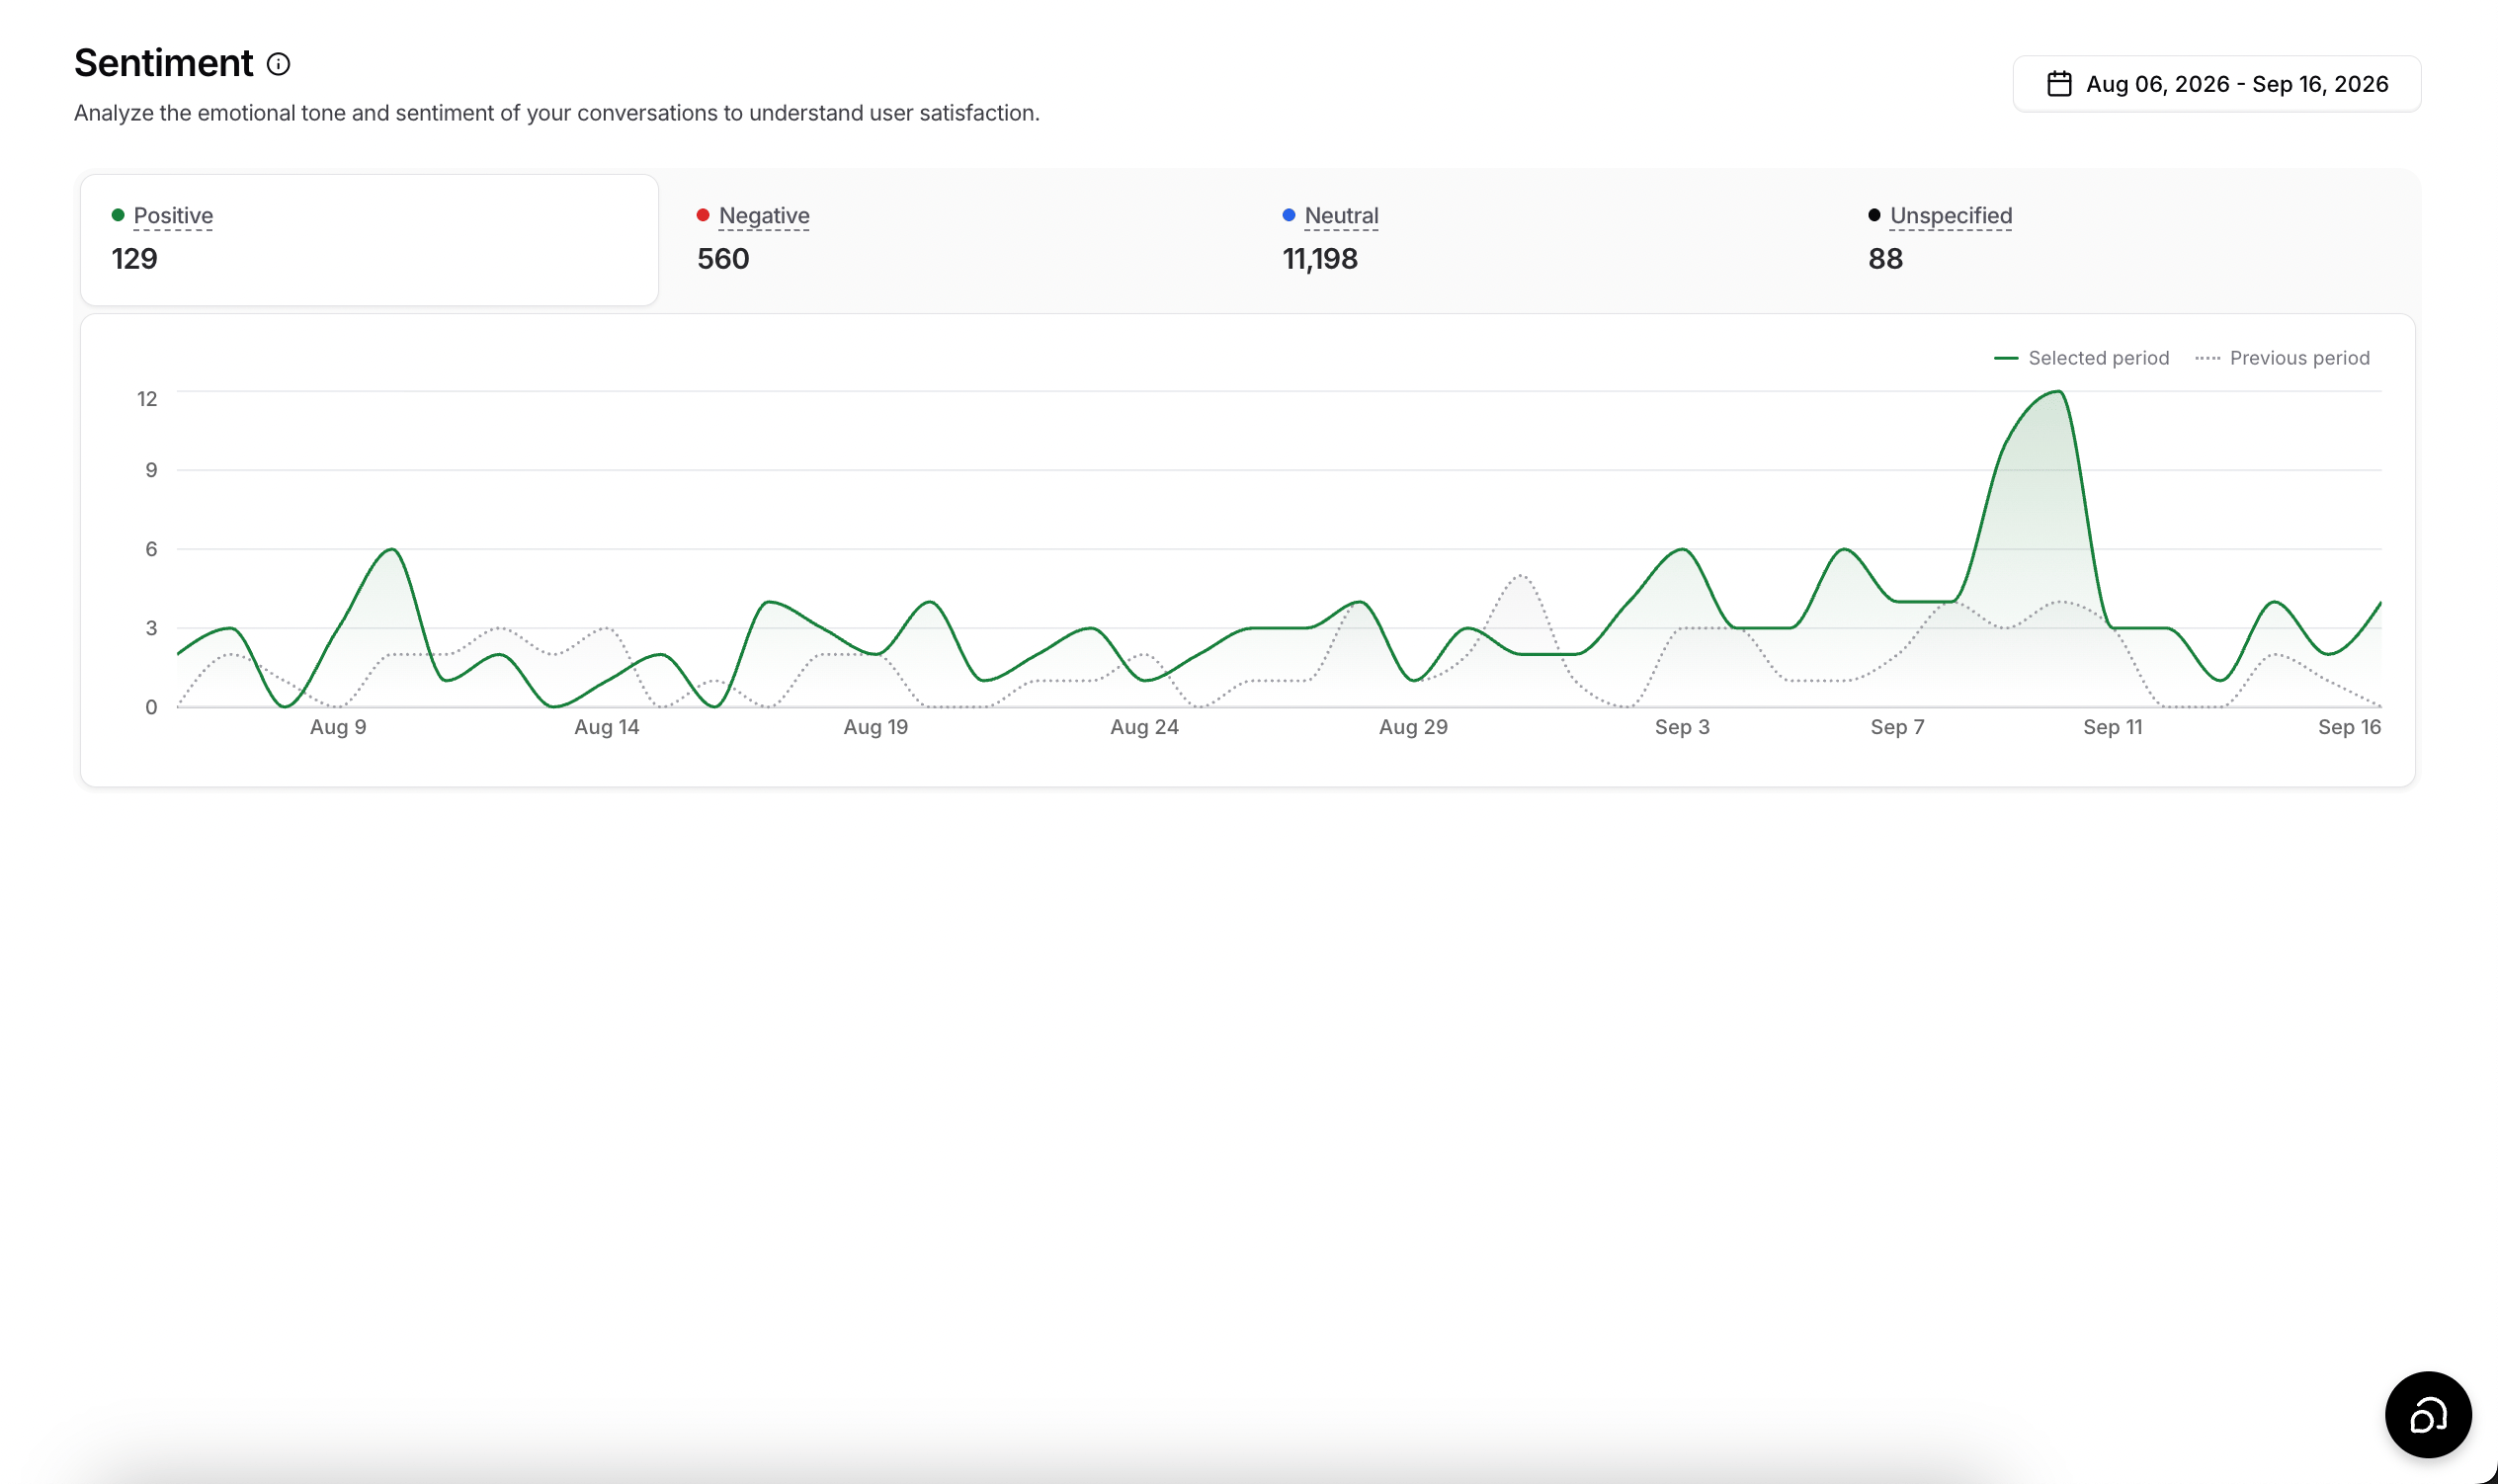
Helpdesk
Track ticket volume over time to monitor your support workload and resolution trends. Most metrics on this page show their change against the previous period, and the line charts plot the Selected period as a solid line against the Previous period as a dotted one.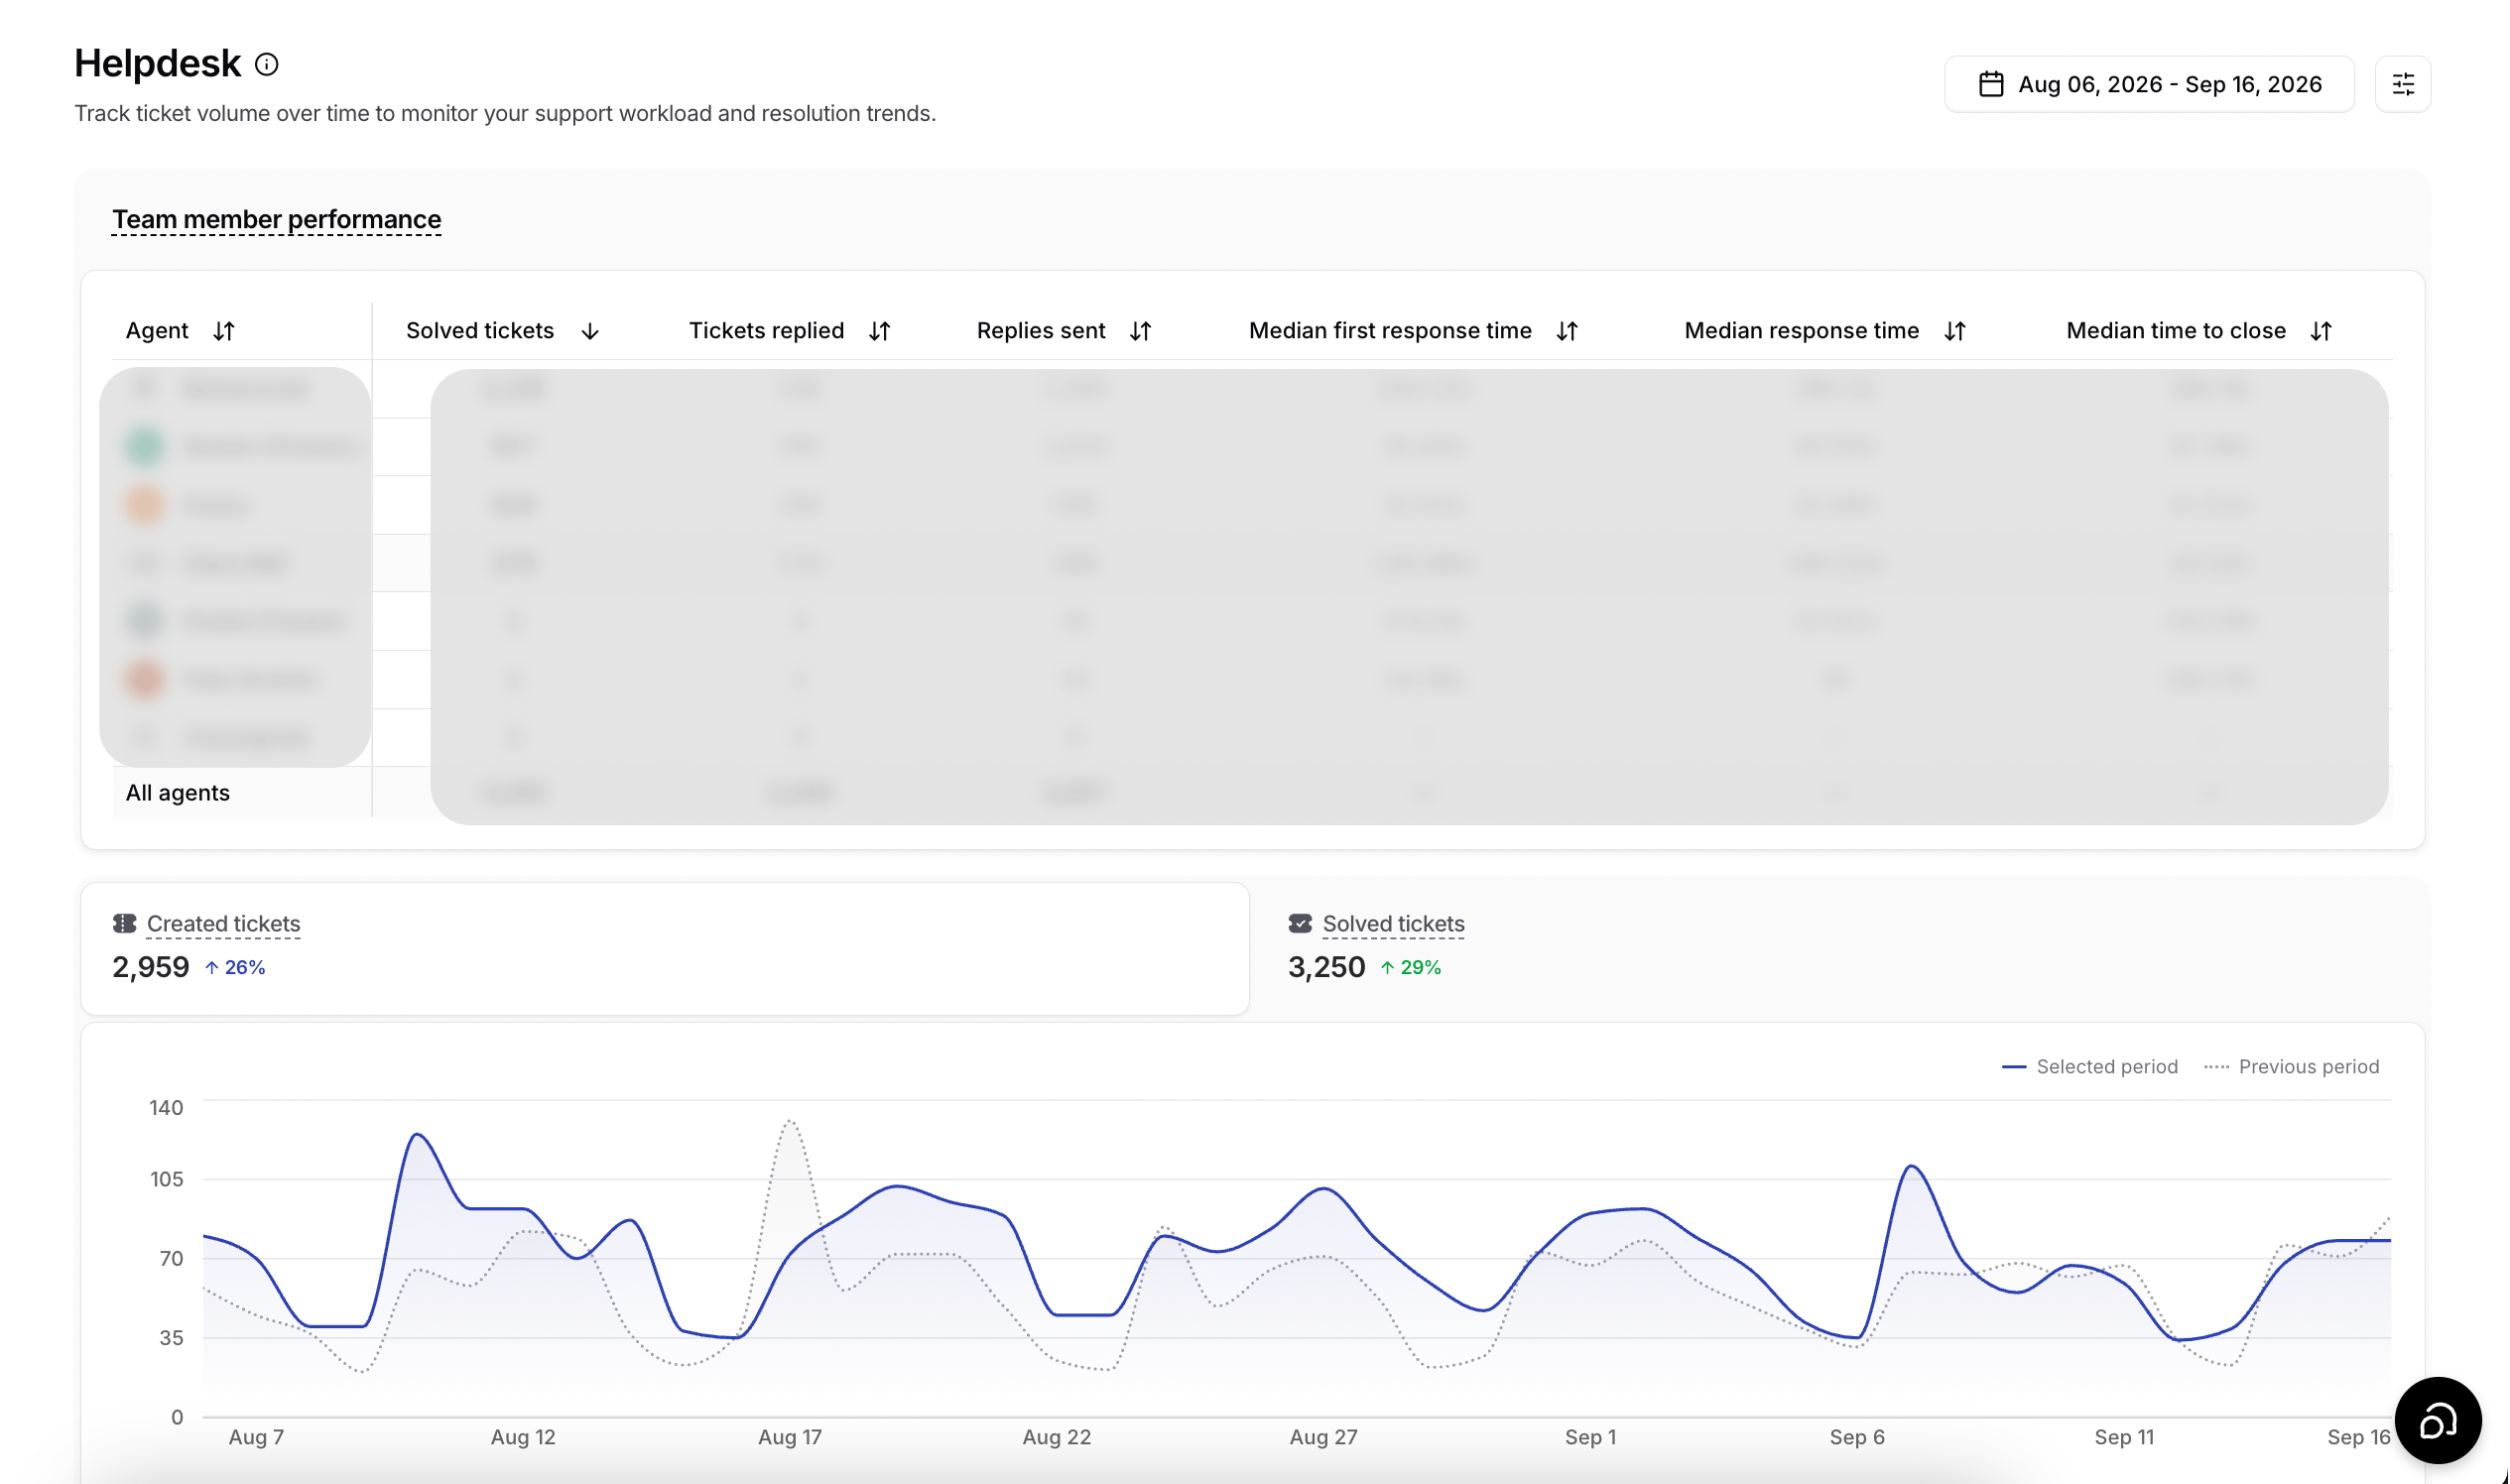
Team member performance
The table at the top of the page breaks the period down by team member, so you can see how the workload is spread across your human agents:- Solved tickets: tickets that member marked solved.
- Tickets replied: tickets they replied to at least once.
- Replies sent: the total number of replies they sent.
- CSAT: the CSAT score of the surveys credited to that member, with the number of answers below it. A survey is credited to whoever was assigned to the ticket when it was closed.
- Rating columns: one column per rating scale in use. Stars and Smileys show the member’s average answer, and the 👍 and 👎 columns count each thumb.
- Median first response time: how long customers waited for that member’s first reply.
- Median response time: the median across all of their replies.
- Median time to close: how long their tickets stayed open before being solved.
Ticket volume
- Created tickets: tickets opened during the period.
- Solved tickets: tickets marked solved during the period.
- Unsolved tickets: the outstanding backlog, plotted on its own chart so you can see whether it is growing or shrinking.
- Agent replies sent: replies sent by human agents during the period, charted beside Unsolved tickets. Internal notes, automated messages, and AI agent replies are excluded.
Response times
- Median first response time: how long a customer waits for the first human reply.
- Median response time: the median across all replies, not just the first.
- Median time to close: how long a ticket stays open before it is solved.
Resolution rates
- Resolved on first contact rate: solved tickets that were resolved in a single interaction, without the customer having to follow up, as a share of all solved tickets.
- Resolved on first reply rate: solved tickets that were resolved with a single reply from a human agent, as a share of all solved tickets.
Tickets by channel
Breaks ticket volume down by where the tickets arrived from, such as Email, Widget/Iframe, or API.Customer satisfaction (CSAT)
Shows how customers rated the support they received, based on the CSAT surveys sent after tickets are closed.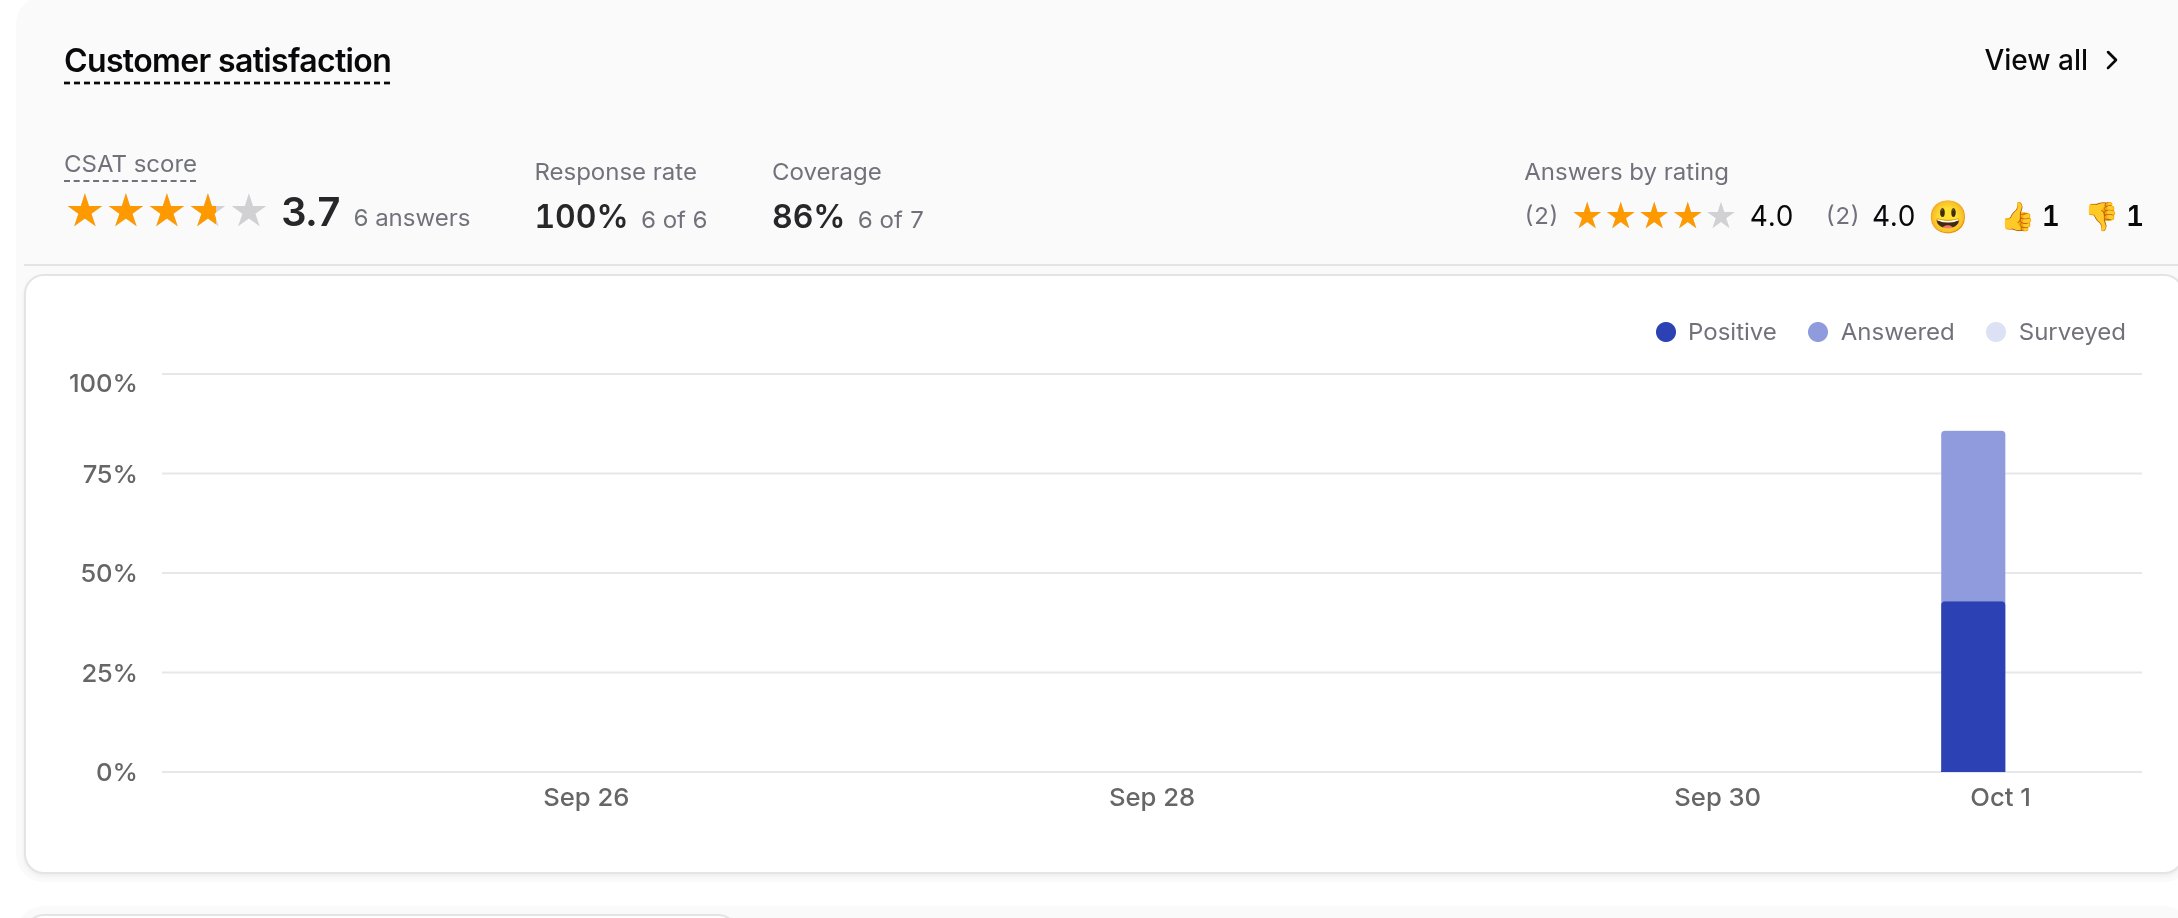
- CSAT score: when every answer in the period is a thumb, the share of answers that were 👍. As soon as any answer uses Stars or Smileys, the score becomes the average answer from 1 to 5, with 👍 counted as 5 and 👎 as 1. The CSAT score also shows its change against the previous period.
- Response rate: answered surveys as a share of surveys sent.
- Coverage: surveys sent as a share of closed tickets that could have been surveyed.
- Answers by rating: a breakdown for each rating scale used in the period, with the number of each thumb and the average for Stars and for Smileys. Hover over a scale to see how many answers each rating got.
Filtering
Use the date range picker to set the period. The filter button beside it narrows the whole page by Assignee, Channel, Type, or Last message by. Pick a field, choose an operator such as is any of, then select the values and click Apply. Discard clears the filter you were editing.Limitations
- Data is updated with a 1-day delay, reflecting the previous day’s information.
- Data is only recorded once you subscribe to a plan. Topics and sentiment are only available after the upgrade, and anything from before it is not included.
- Message totals and credits are counted differently. The page shows the total number of messages, including all conversation messages, but credits are only calculated for AI-generated responses, excluding the initial messages.
Next steps
Activity
Read the individual conversations behind these totals.
Usage
Track message credits consumed across your AI agents.
Help Desk
Work the tickets these helpdesk metrics are measuring.
Best Practices
Act on what the numbers tell you about answer quality.